CLICK
Click
Counts a click on any element you point at. Buttons, links, cards, anything on the page.
3 metric types you define yourself: a click, a page someone reaches, or an event your own code sends. Purchases are the fourth kind, and you never build that one. It arrives with your shop connection, orders and their value included. Define a metric once, then reuse it across one project or your whole organisation. And when a result is too weak to act on, we say so.
Start free, no cardCounts a click on any element you point at. Buttons, links, cards, anything on the page.
Counts a visit to a page you name. You choose how the address is matched.
Counts an event your own code sends, so anything your app already knows about can become a metric.
The one you never build by hand. Connect your shop and orders arrive with their value attached, so revenue is read straight from the orders.
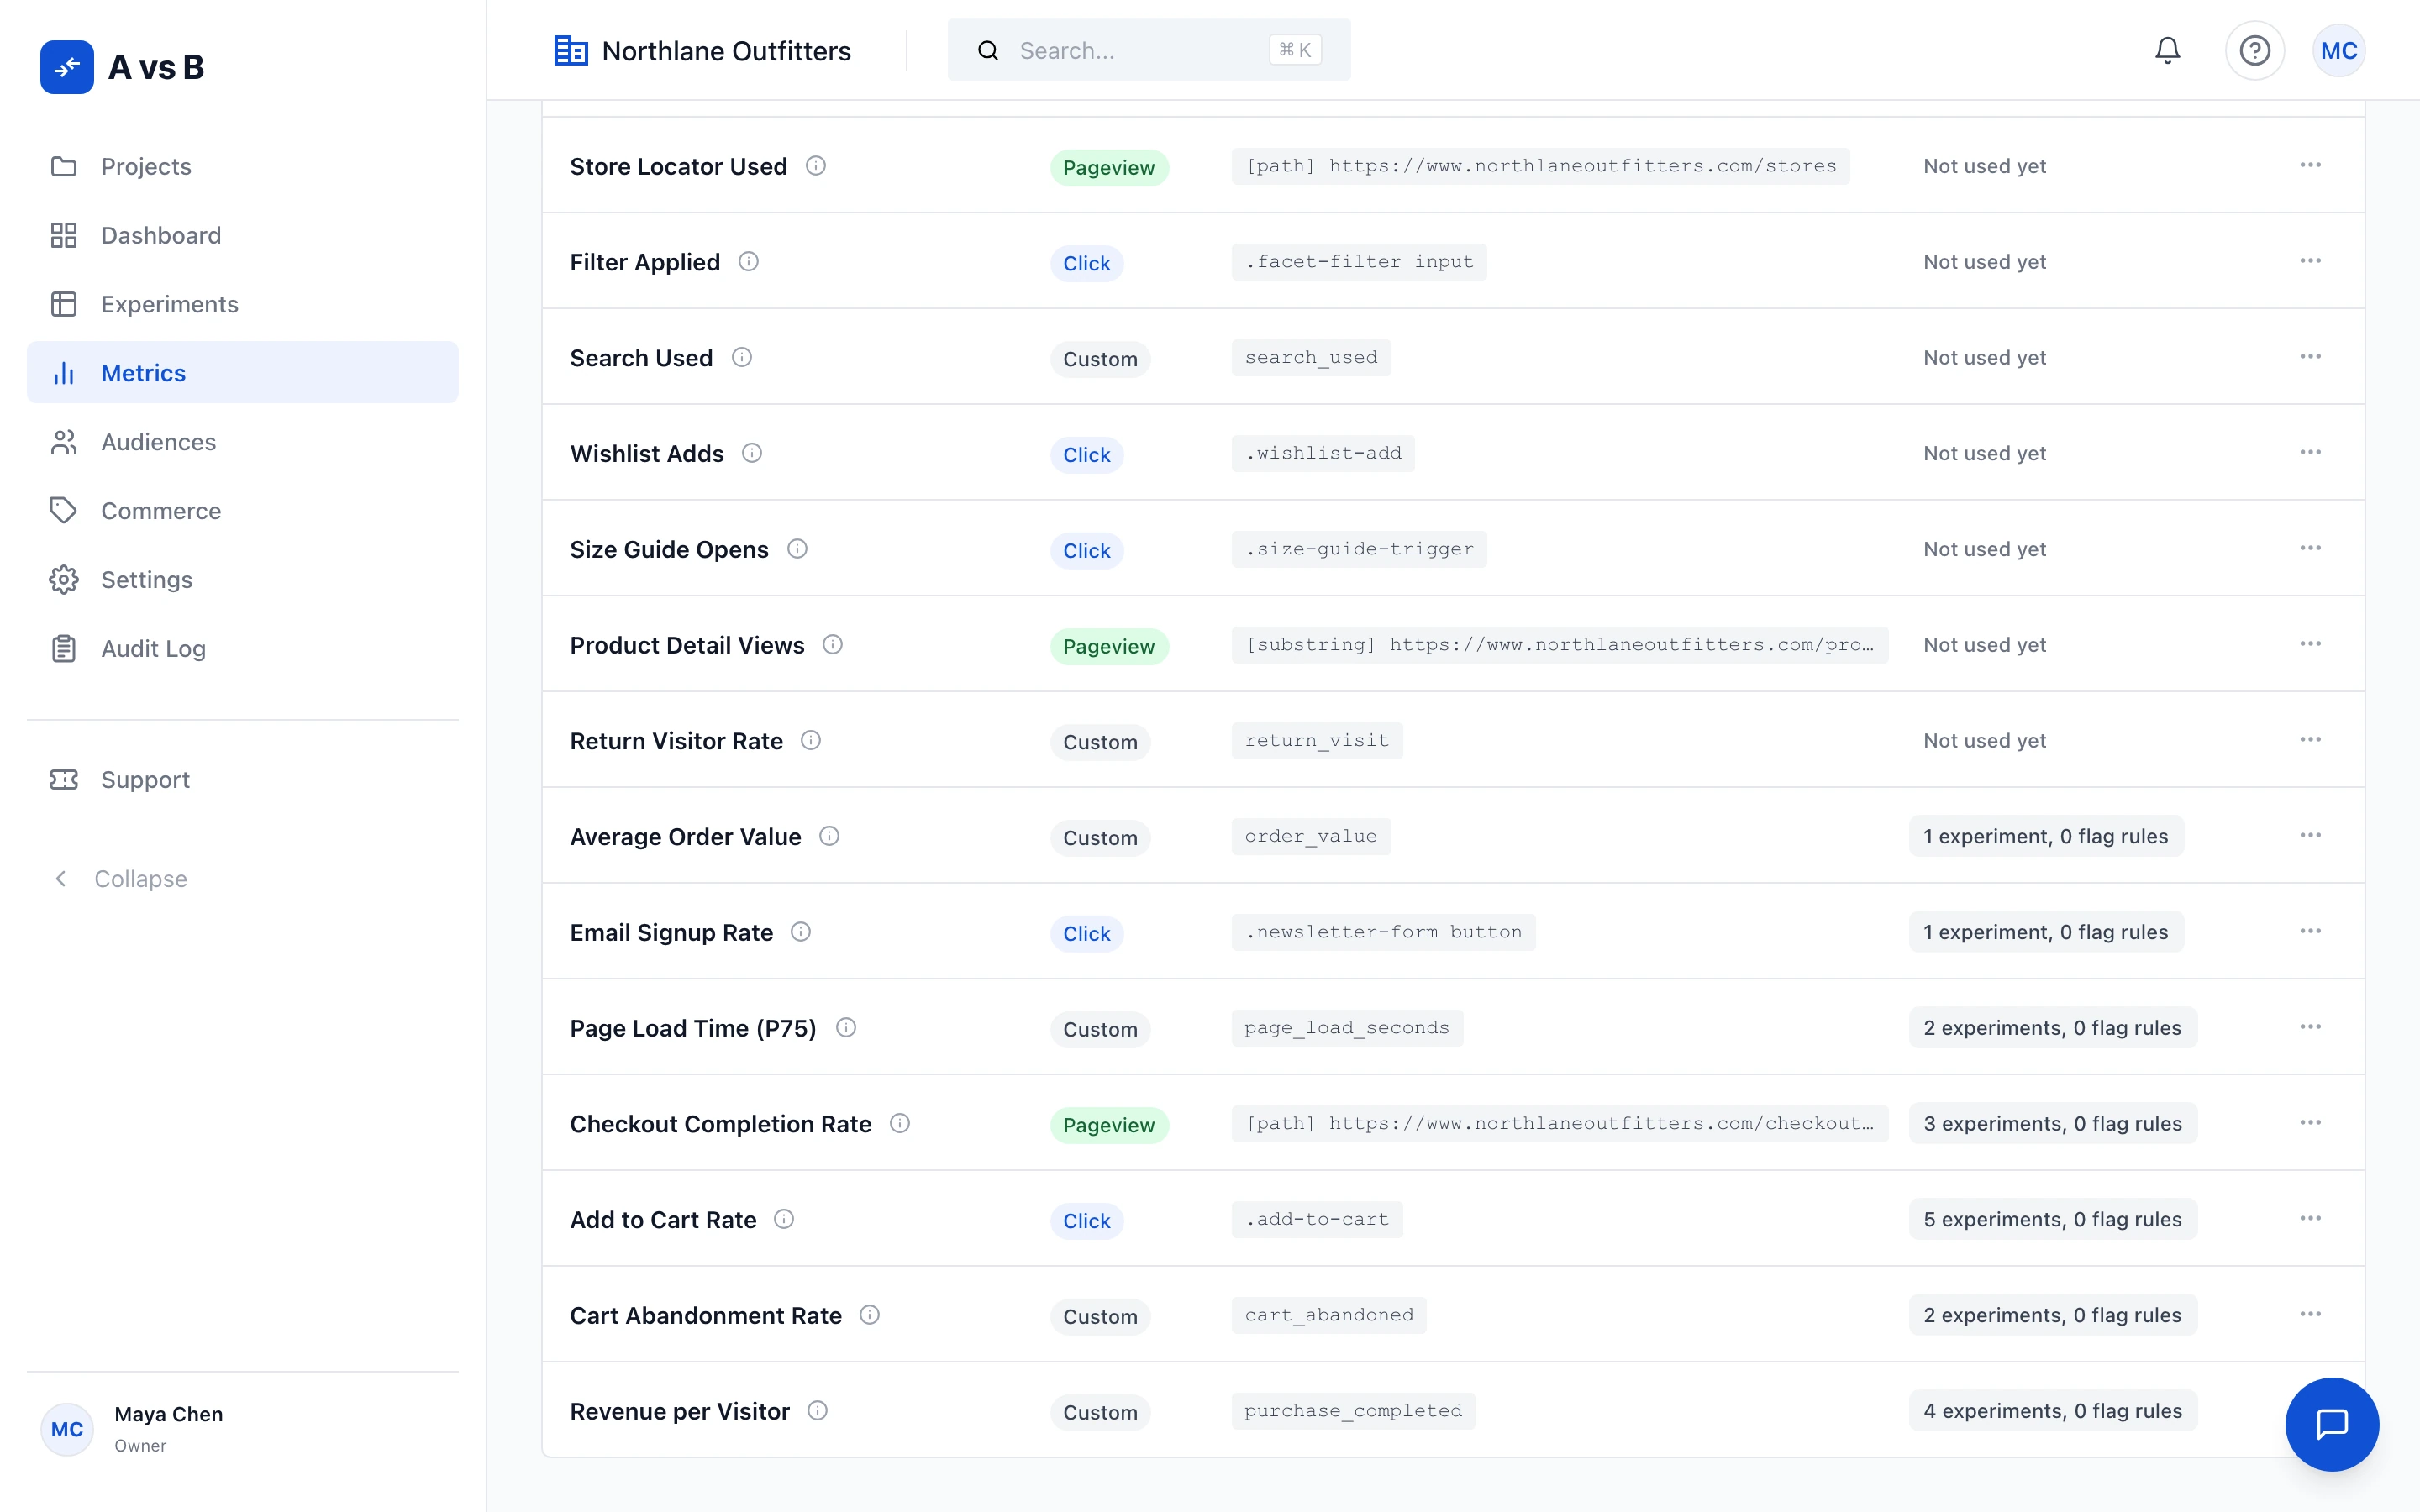

A metric belongs to your organisation, and you choose how far it reaches. Keep it to a single project when it only makes sense there, or leave it organisation wide so every project can use it.
Either way the definition lives in one place. Attach it to as many experiments as you like without copying it, and change it once when your site changes. Two teams measuring “sign-ups” then measure the same thing.
Revenue, sign-ups, and anything every team measures the same way. Defined once, available to everyone.
Metrics that only mean something on one site or one app. They stay there, and no other project sees them.
Every metric you attach to an experiment plays one of three parts. The part it plays sets what it is allowed to do to the result.
The one metric the decision rests on, and you get exactly one. The verdict comes from it and nothing else, so a supporting metric that happened to look good cannot become the win later.
Add as many supporting metrics as you want. They are reported in full, with the same statistics as the primary. They give you context, and they never decide the result.
A metric you are protecting rather than trying to improve. Each one is tested to see whether the change quietly hurt it. A confirmed breach stops the experiment, however well the primary did.
A guardrail is tested, not just watched. You set how much worse is too much, and the test gives one of three honest answers. Safe means harm past your line has been ruled out at your confidence level. Breached means a drop past the line has actually been established. Inconclusive means neither, yet. A guardrail that has not ruled harm out is never reported as safe, and a small dip that stays inside your line does not raise a false alarm.

Revenue per visitor is measured as an amount of money, with its own interval. It is not a purchase-or-not rate with a currency sign on it. That is why a small conversion win that doubles the basket still wins the experiment: the amount each visitor spent is what gets compared, so a bigger basket has somewhere to show up.
When your primary metric carries money, the result puts a price on the decision. It shows roughly what shipping the challenger would cost you each month if the challenger is really worse, next to what keeping the original would cost you each month if the challenger is really better. Two figures, in your currency, so you can make the call in business terms rather than statistical ones.
The card appears only when the primary metric really carries money and there has been traffic across enough separate days to project a month honestly. If something is missing, the card is left out rather than filled with a guess.
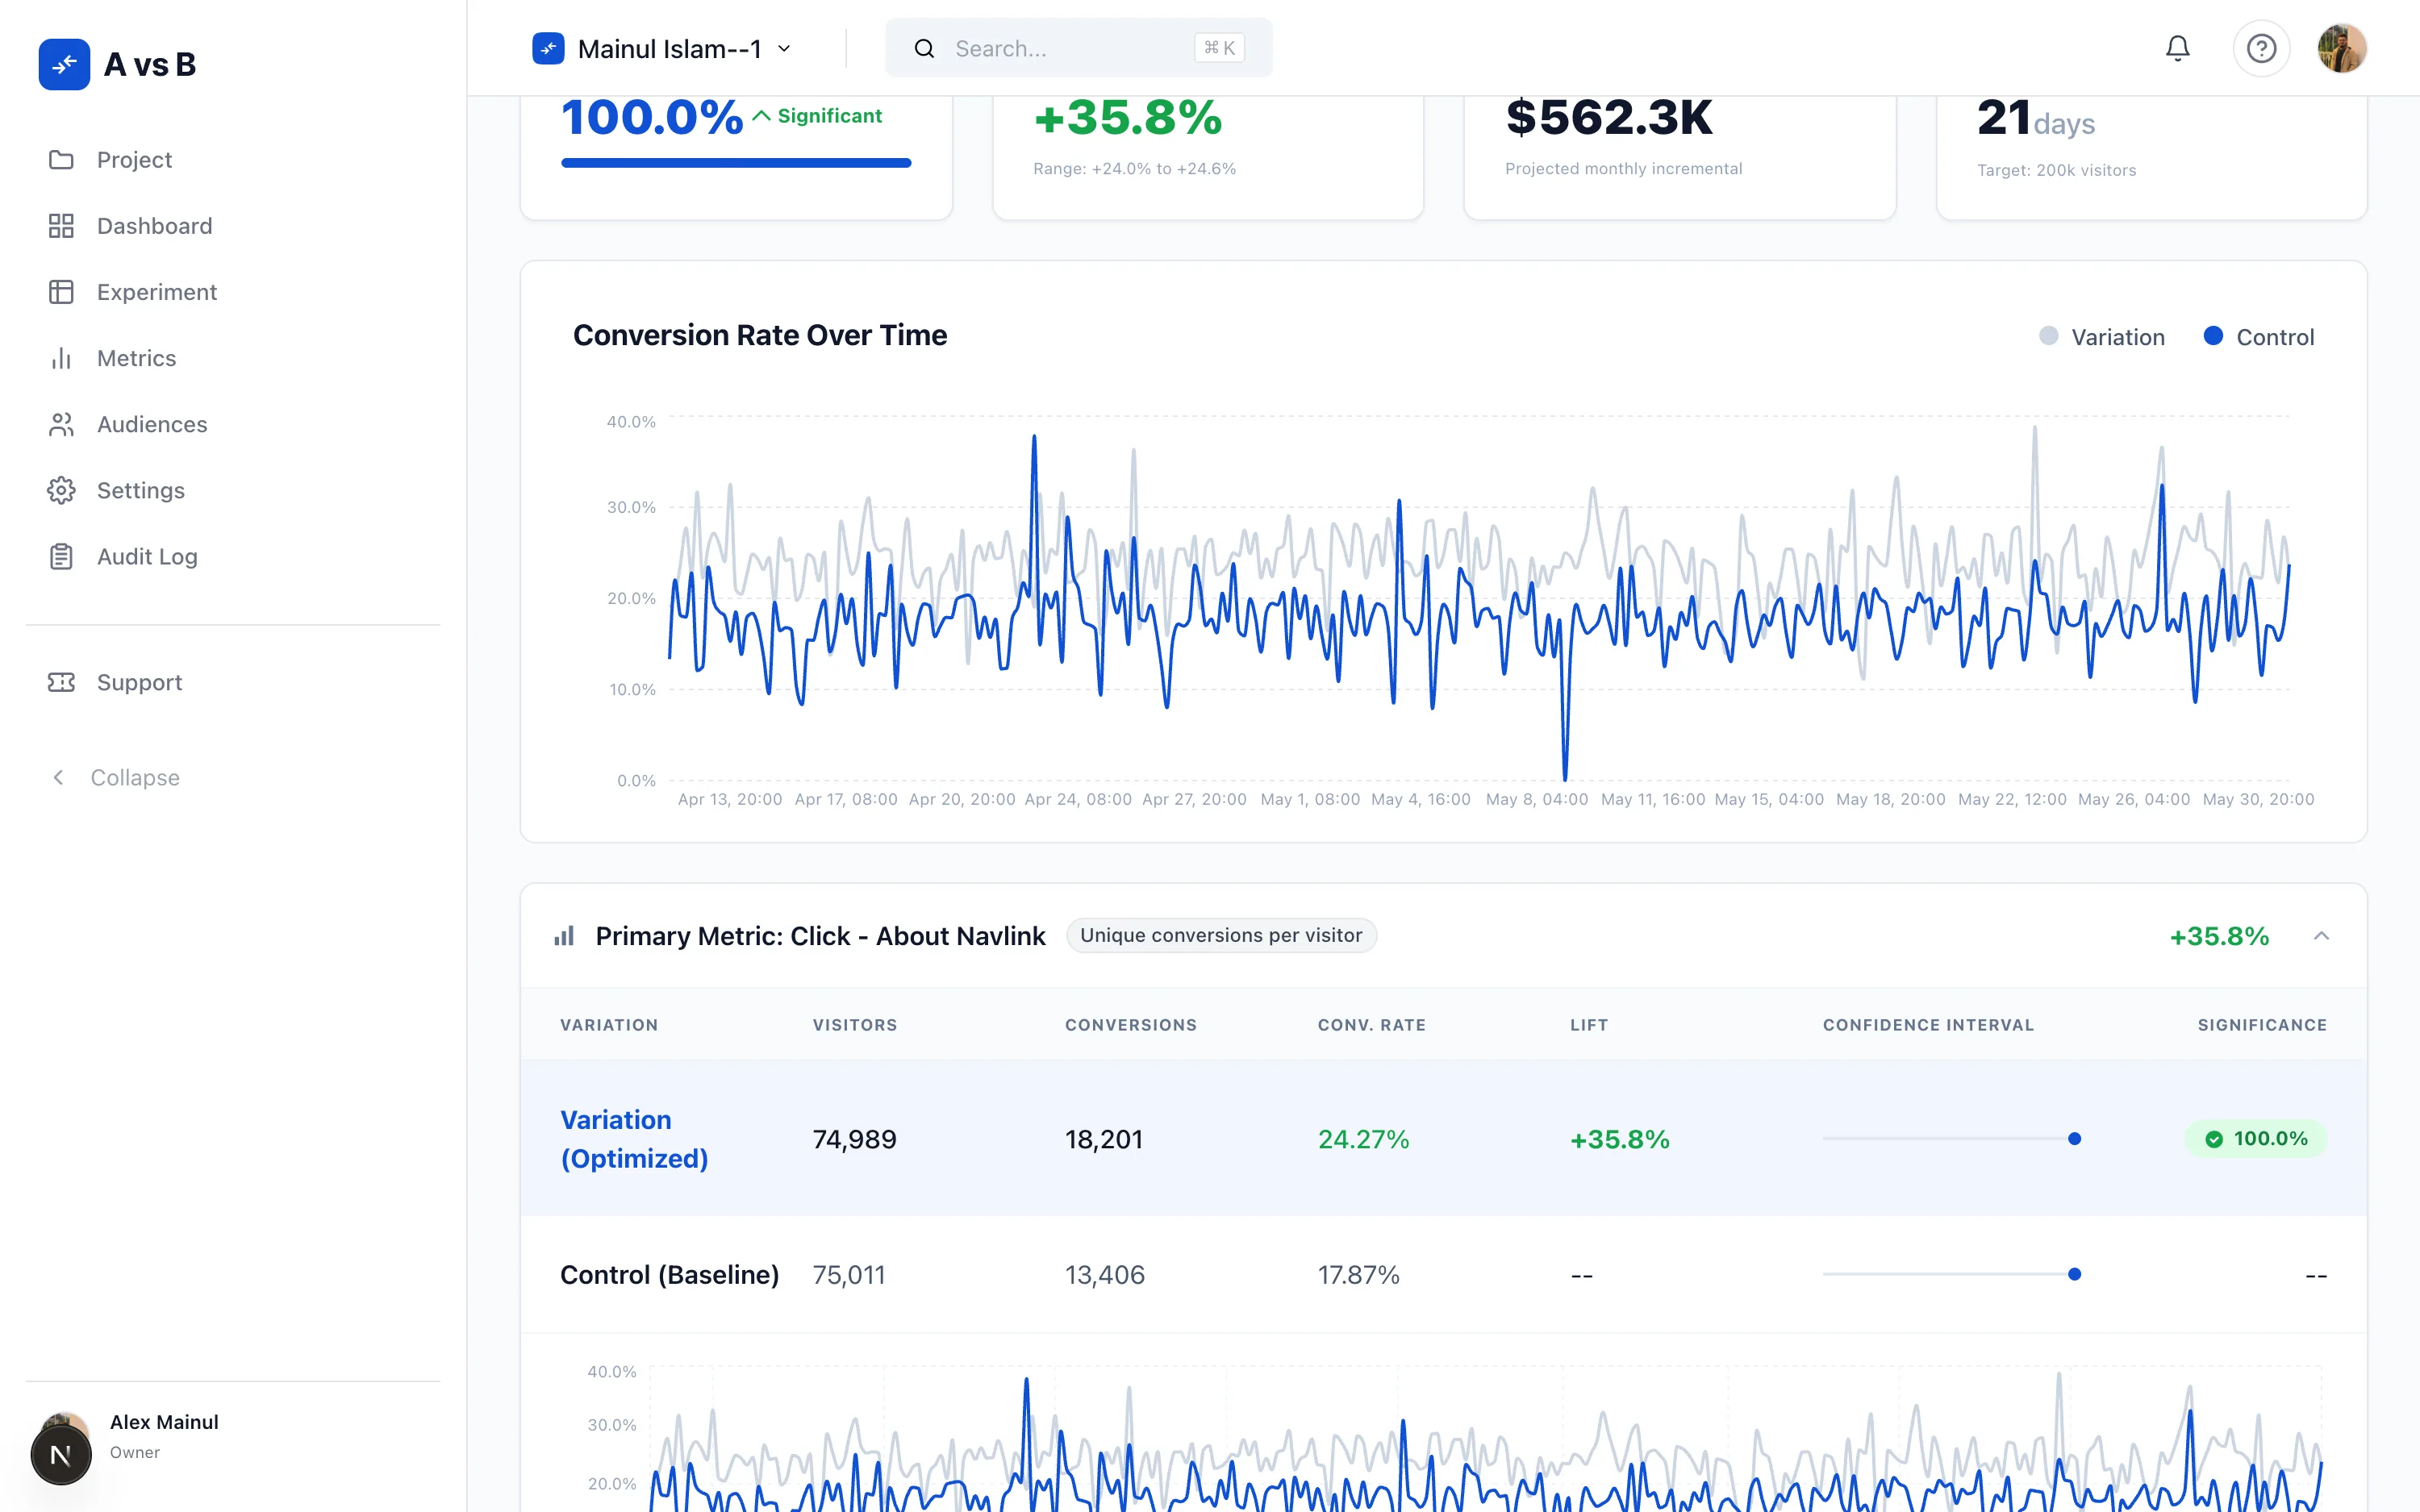
Every result is graded from A to F, out of 100. The grade scores how the experiment was run, not how much you want it to have worked. It looks at five things: whether the plan was sealed before launch and then stuck to, whether you reached the sample you planned for, how many times the result was looked at before the call, whether the traffic split held, and whether it ran long enough with enough traffic in its smallest group. Each part shows its own points and the sentence explaining them.
The formula is fixed. There is no AI anywhere in it, and there is no way to override it. A grade you disagree with is fixed by fixing the experiment, not by arguing with the grader.
Two things cap the grade, however well everything else scores. A broken traffic split caps it at D, because every number resting on a broken split is suspect. A lift too large to be believable caps it at B until you have checked your tracking.
And if the grade cannot be worked out honestly, because the record of how often the result was looked at cannot be read, no grade is shown at all. You get no letter rather than one that was not earned.

A result you are reading because it won is biased upward. That is not a flaw in your test. It is what picking the winner does to the number: among all the experiments that cleared the bar, the lucky ones are over-represented. So next to the observed lift we show a corrected one, worked out from this experiment’s own figures using a published method. No cross-experiment history, no simulation, and the same answer every time.
Next to it we report the odds that this is the wrong call: the chance the true effect points the other way, given that a result like this one is what got selected.
And if you filter a result down to a slice after seeing it, you still get every number, because they are worked out correctly and you asked for them. What you do not get is the ship or stop verdict, and the page says why: a group you picked after looking is not a confirmed result, so a winner found only inside it is not a winner yet.
Read the statistical methodology
Combine several measures into one score, with weights you choose. The result breaks that score back down and shows what each part contributed, so you can see where a composite win came from.
When a result looks different on mobile than on desktop, we test whether the difference is real instead of leaving you to compare two numbers by eye. A segment that moves more is a lead worth running as its own experiment, not a result to act on.
Using what a visitor did before the test started narrows the interval, so a real difference shows up sooner. It switches on only when your data supports it, and when it stays off it tells you which condition was not met.

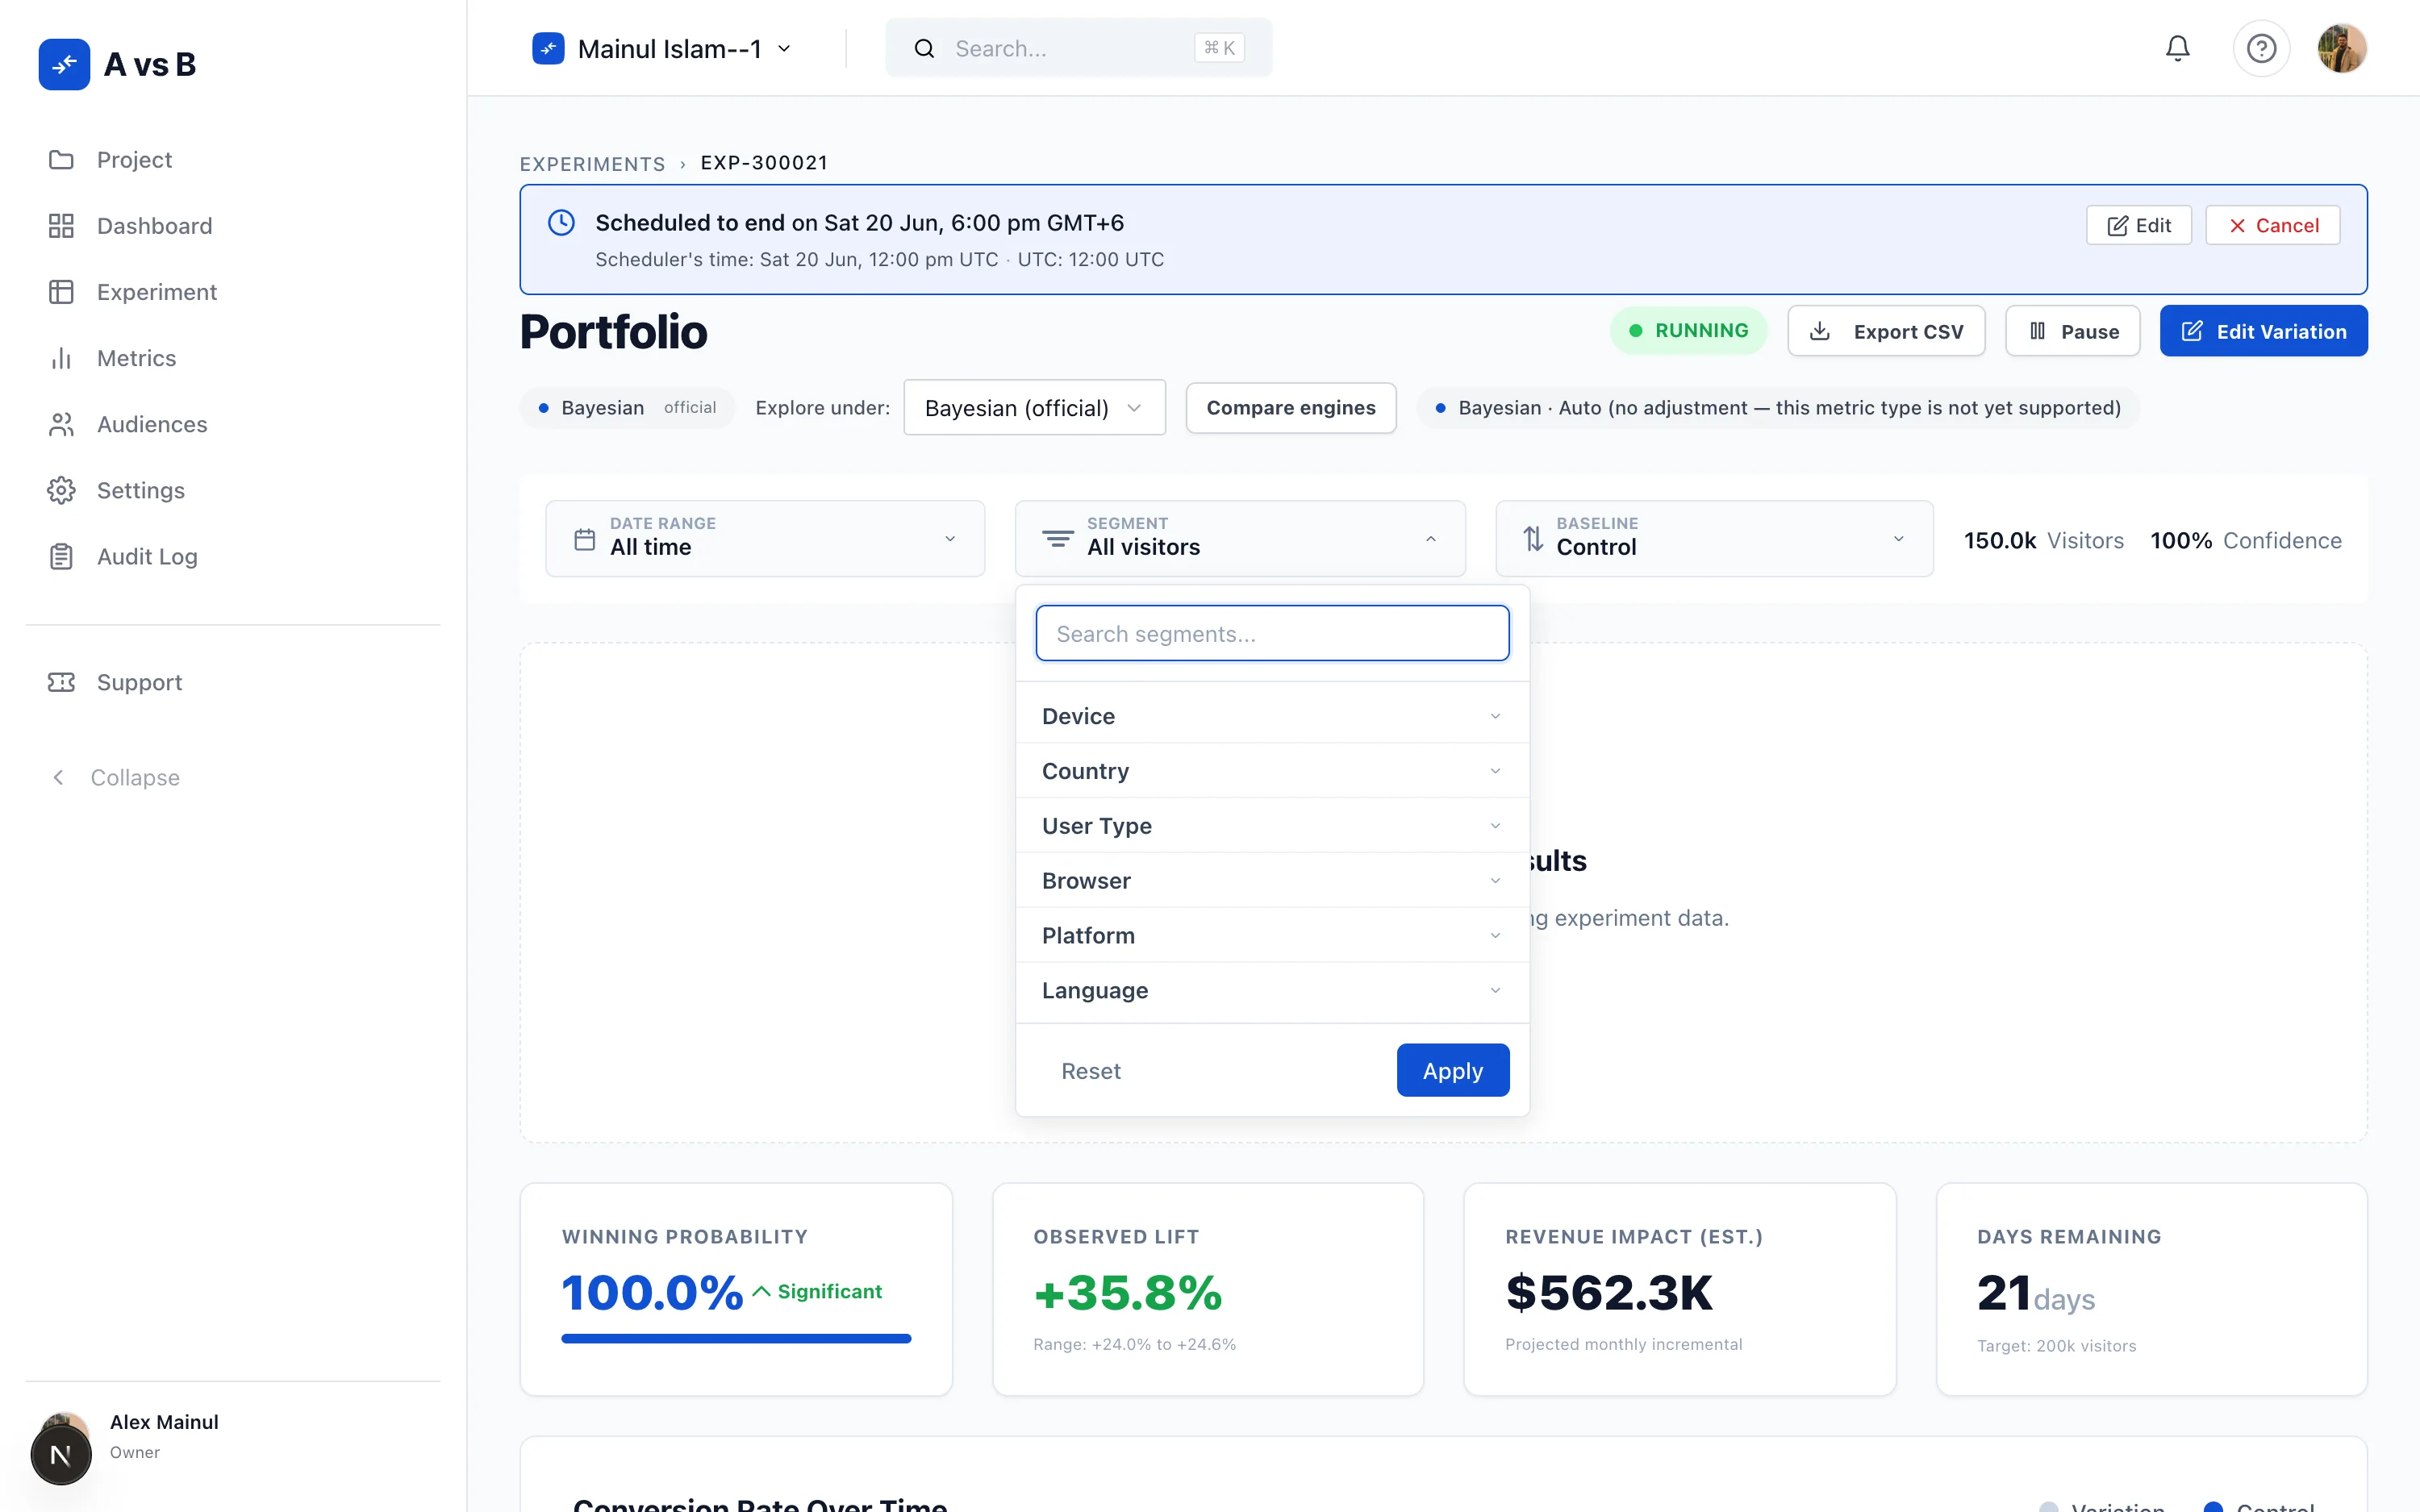
Plan the size of a test before you run it. Say how you are measuring, whether that is a conversion rate, a per-event rate, a percentile or a composite. Say which engine you are planning against: Bayesian, Frequentist or Sequential. Then ask for the sample size you need, the power you already have, or the number of days it will take. Every answer names the method behind it, and inputs that cannot support an answer are told so rather than handed a number.
Free for your first 10,000 visitors a month, no card. Send what you learn to 9 analytics tools or your own webhook.