Anti-flicker
No flash of the original.
The page is held for up to three seconds while the variation applies, then shown all at once, so visitors never see the original flash past.
Platform / Experiments
Build your variation by pointing at your real page, or write the code yourself. Write the plan before you launch, and it seals the moment traffic starts. Then read the result through 3 genuinely different engines: Bayesian, Frequentist, and Sequential. Separate methods, not one formula with settings.
The builder walks you through 5 steps, in order: Targeting, Variations, Metrics, Analysis, and Review.
Start freeThere are 8 kinds of change you can make by pointing and clicking, with no code at all: text, style, visibility, image, reorder, insert, move, and section.
Two more come from the copilot only, because each one needs a plan before it runs: remove element, and custom behaviour.
Apply a change to some screen widths and not others. There are 5 viewport targets: all widths, mobile, tablet, desktop, and custom range.
You get up to 4 variations per experiment: one control and up to 3 challengers. The cap is deliberate. It keeps the sample-size maths able to size every variation you are actually running.
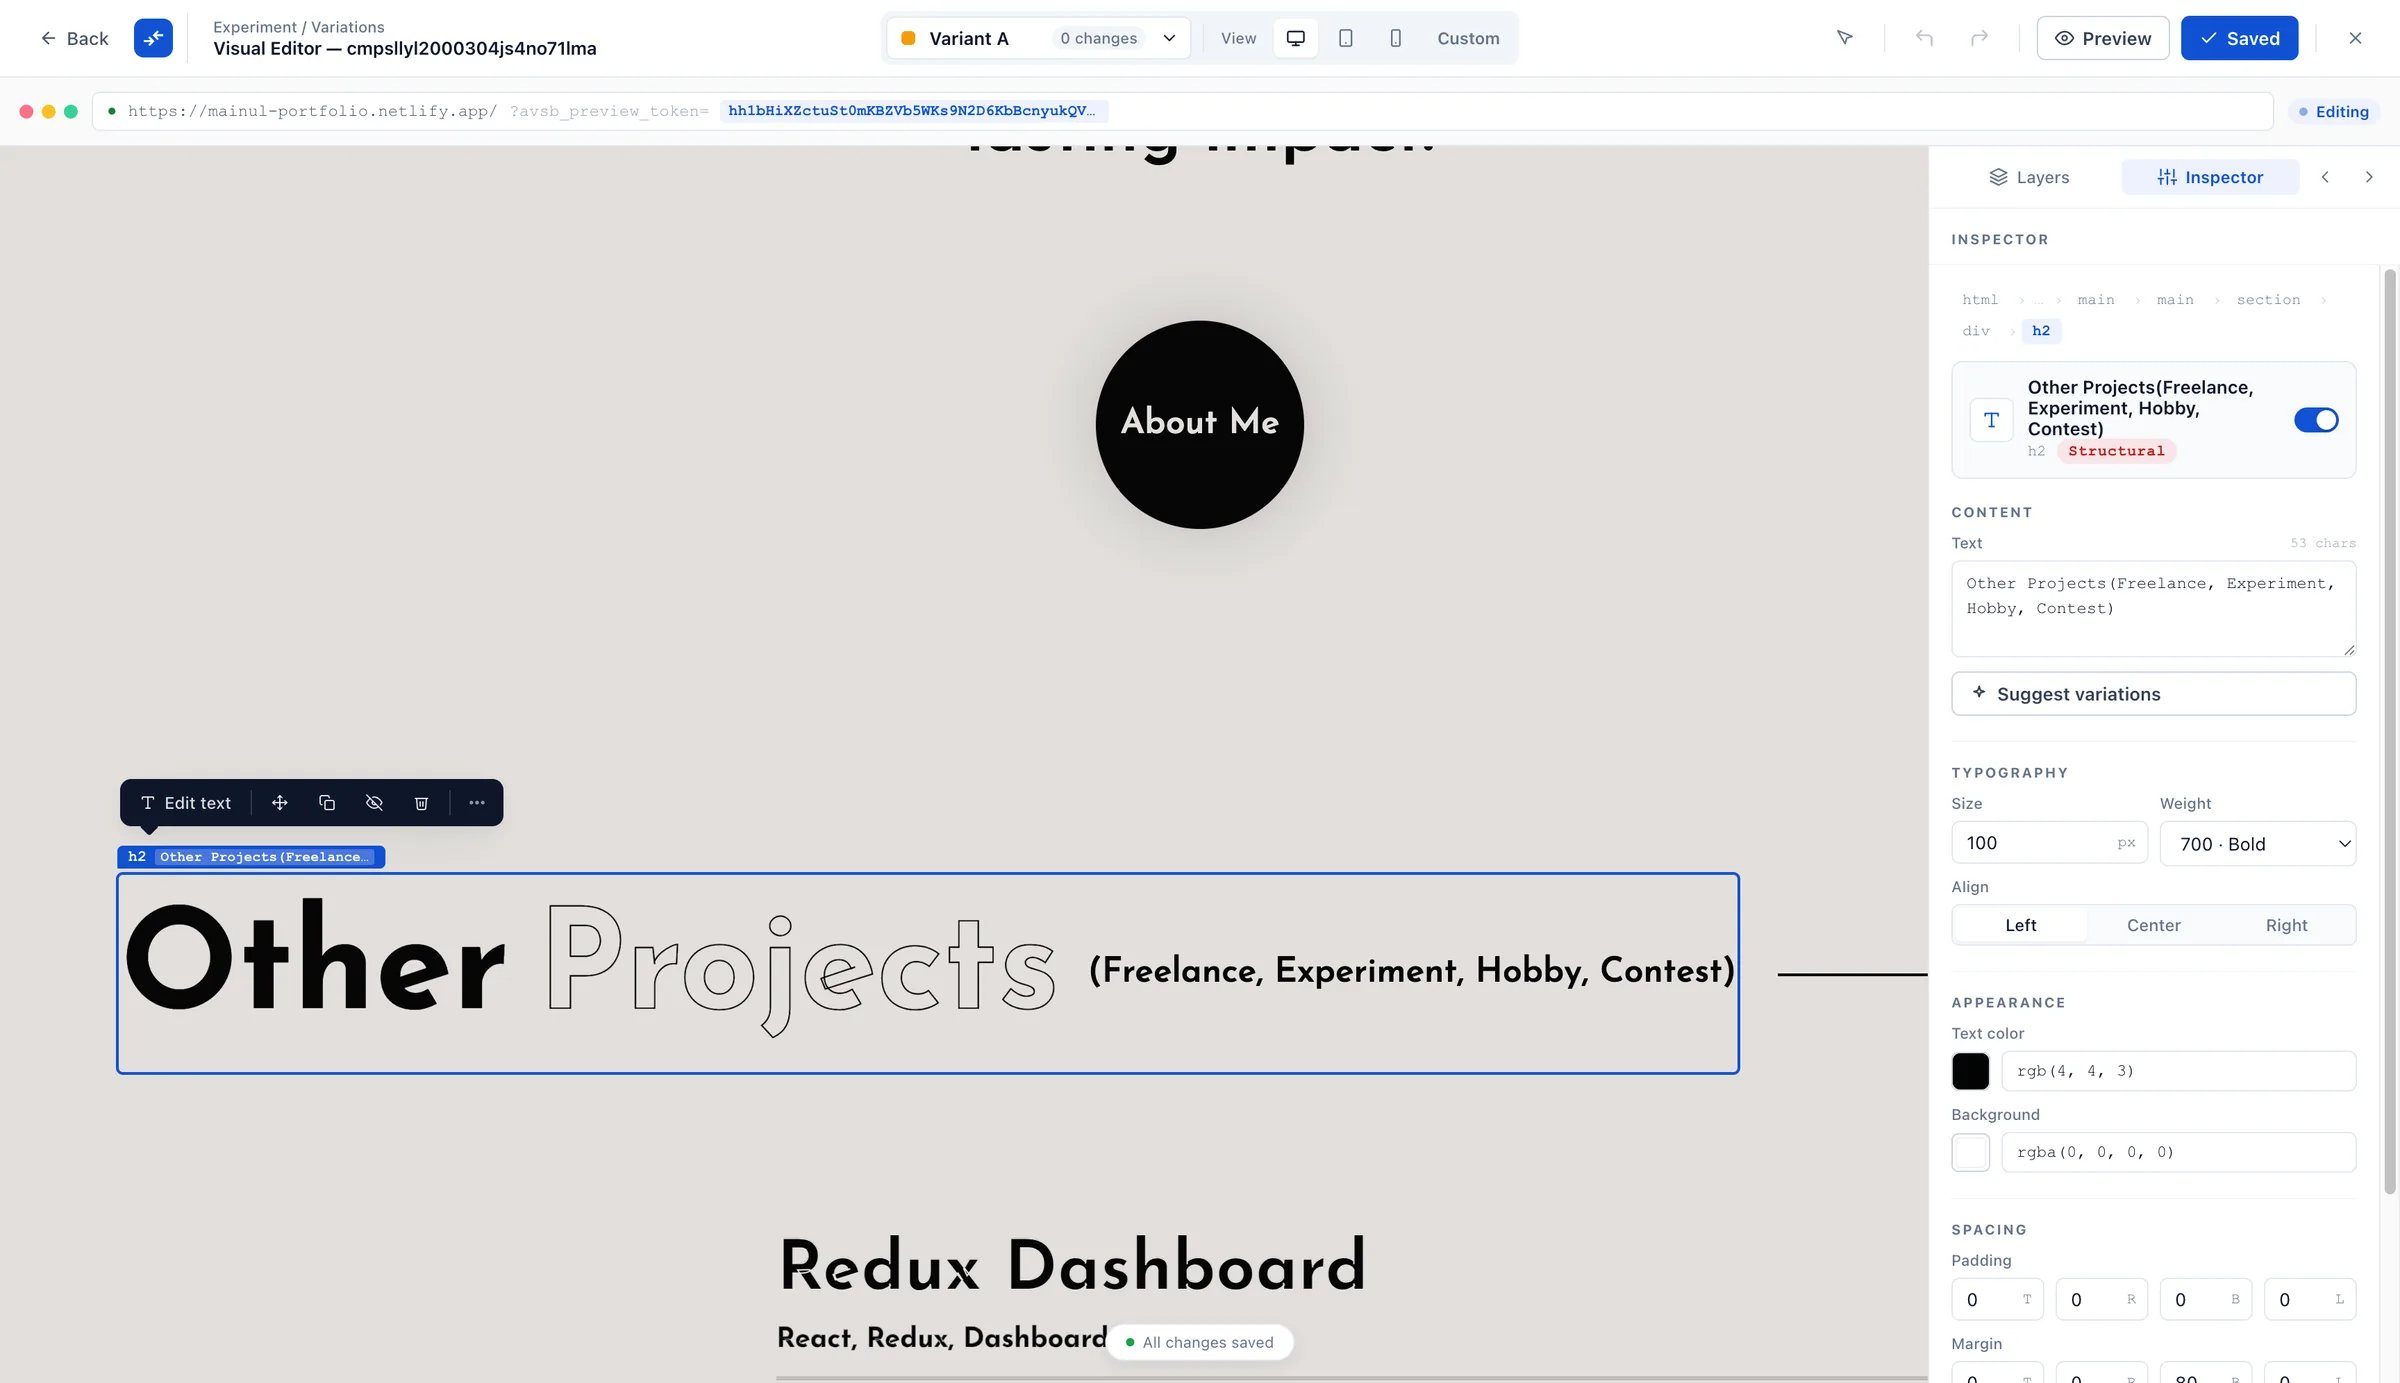
Each variation gets its own script and style files, plus a shared trigger block that decides when the experiment activates. You write scripts in JavaScript, and TypeScript and styles in CSS, and SCSS, in a real editor with autocomplete.
Shared type definitions sit at two levels: one file for an experiment’s variations, and one for the whole project. They are types only, so nothing from them is sent to a visitor’s browser.
1// variant.ts: runs once this variation is applied2const cta = document.querySelector<HTMLButtonElement>('.checkout-cta')3
4if (cta) {5  cta.textContent = 'Claim your 30% discount'6  cta.classList.add('is-urgent')7}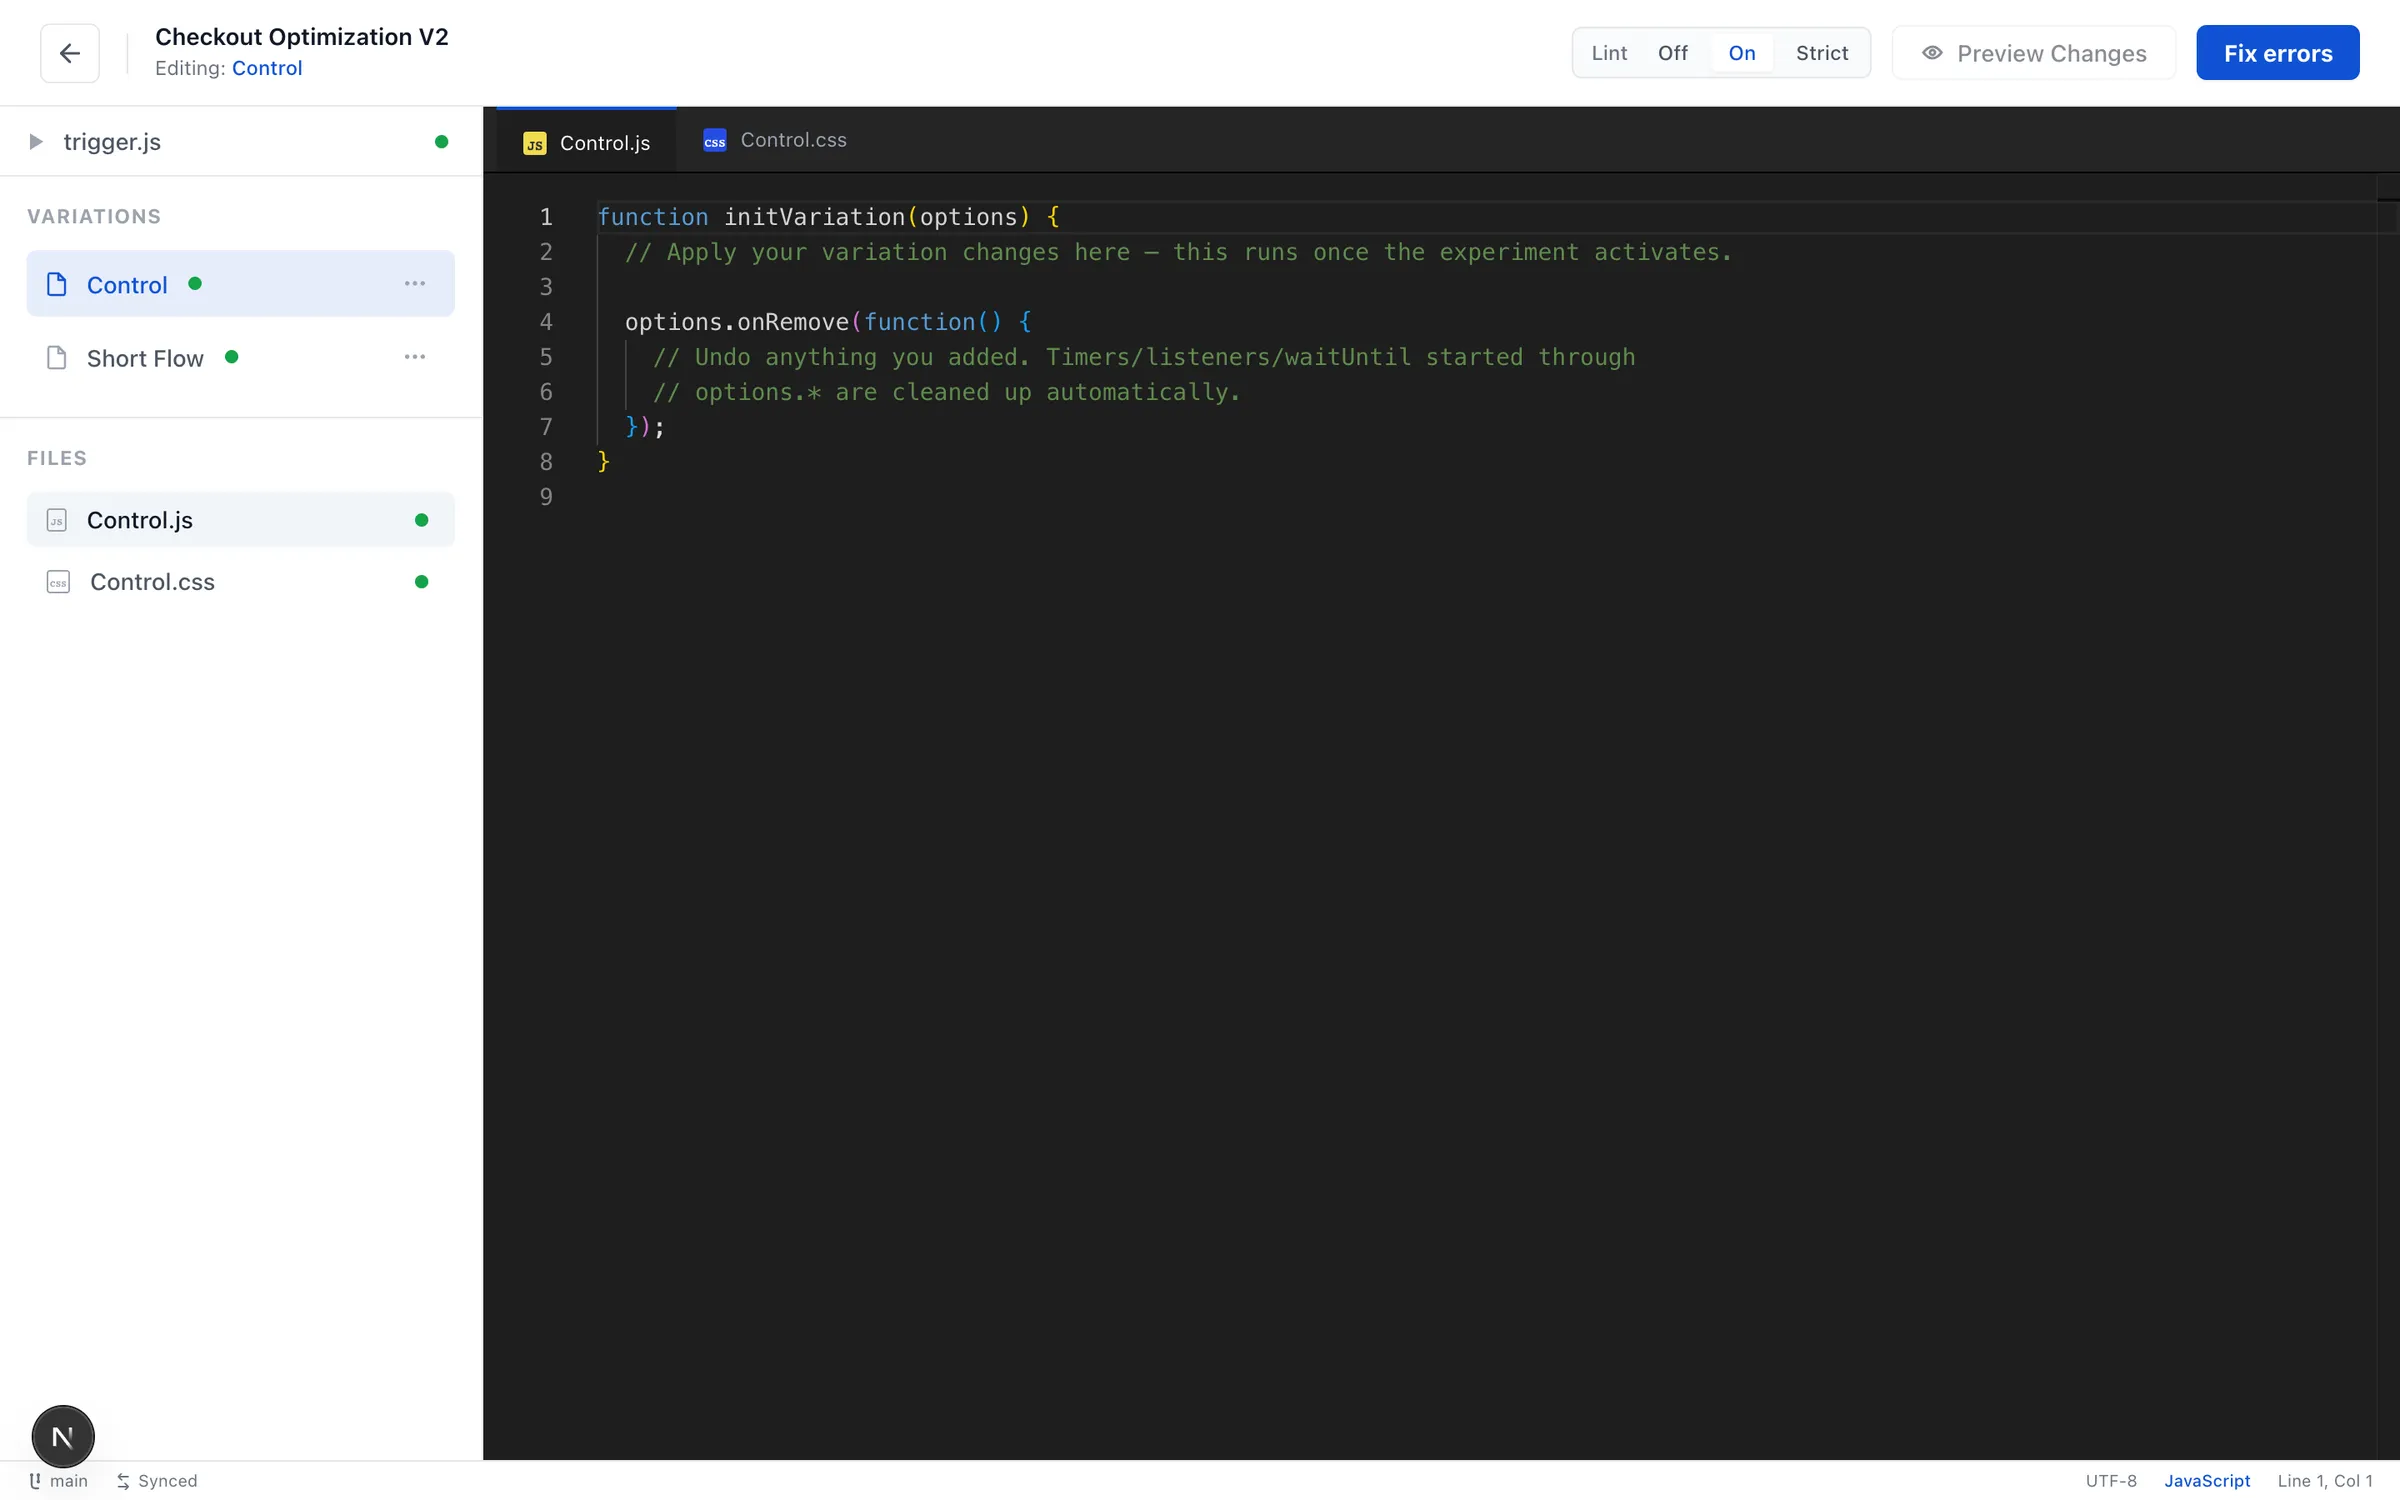
Every save is kept, so you can try things without losing work. Restore any earlier version and carry on from there.
Combine them with AND and OR, nested as deep as you need. Save an audience once and reuse it on any experiment or feature flag.
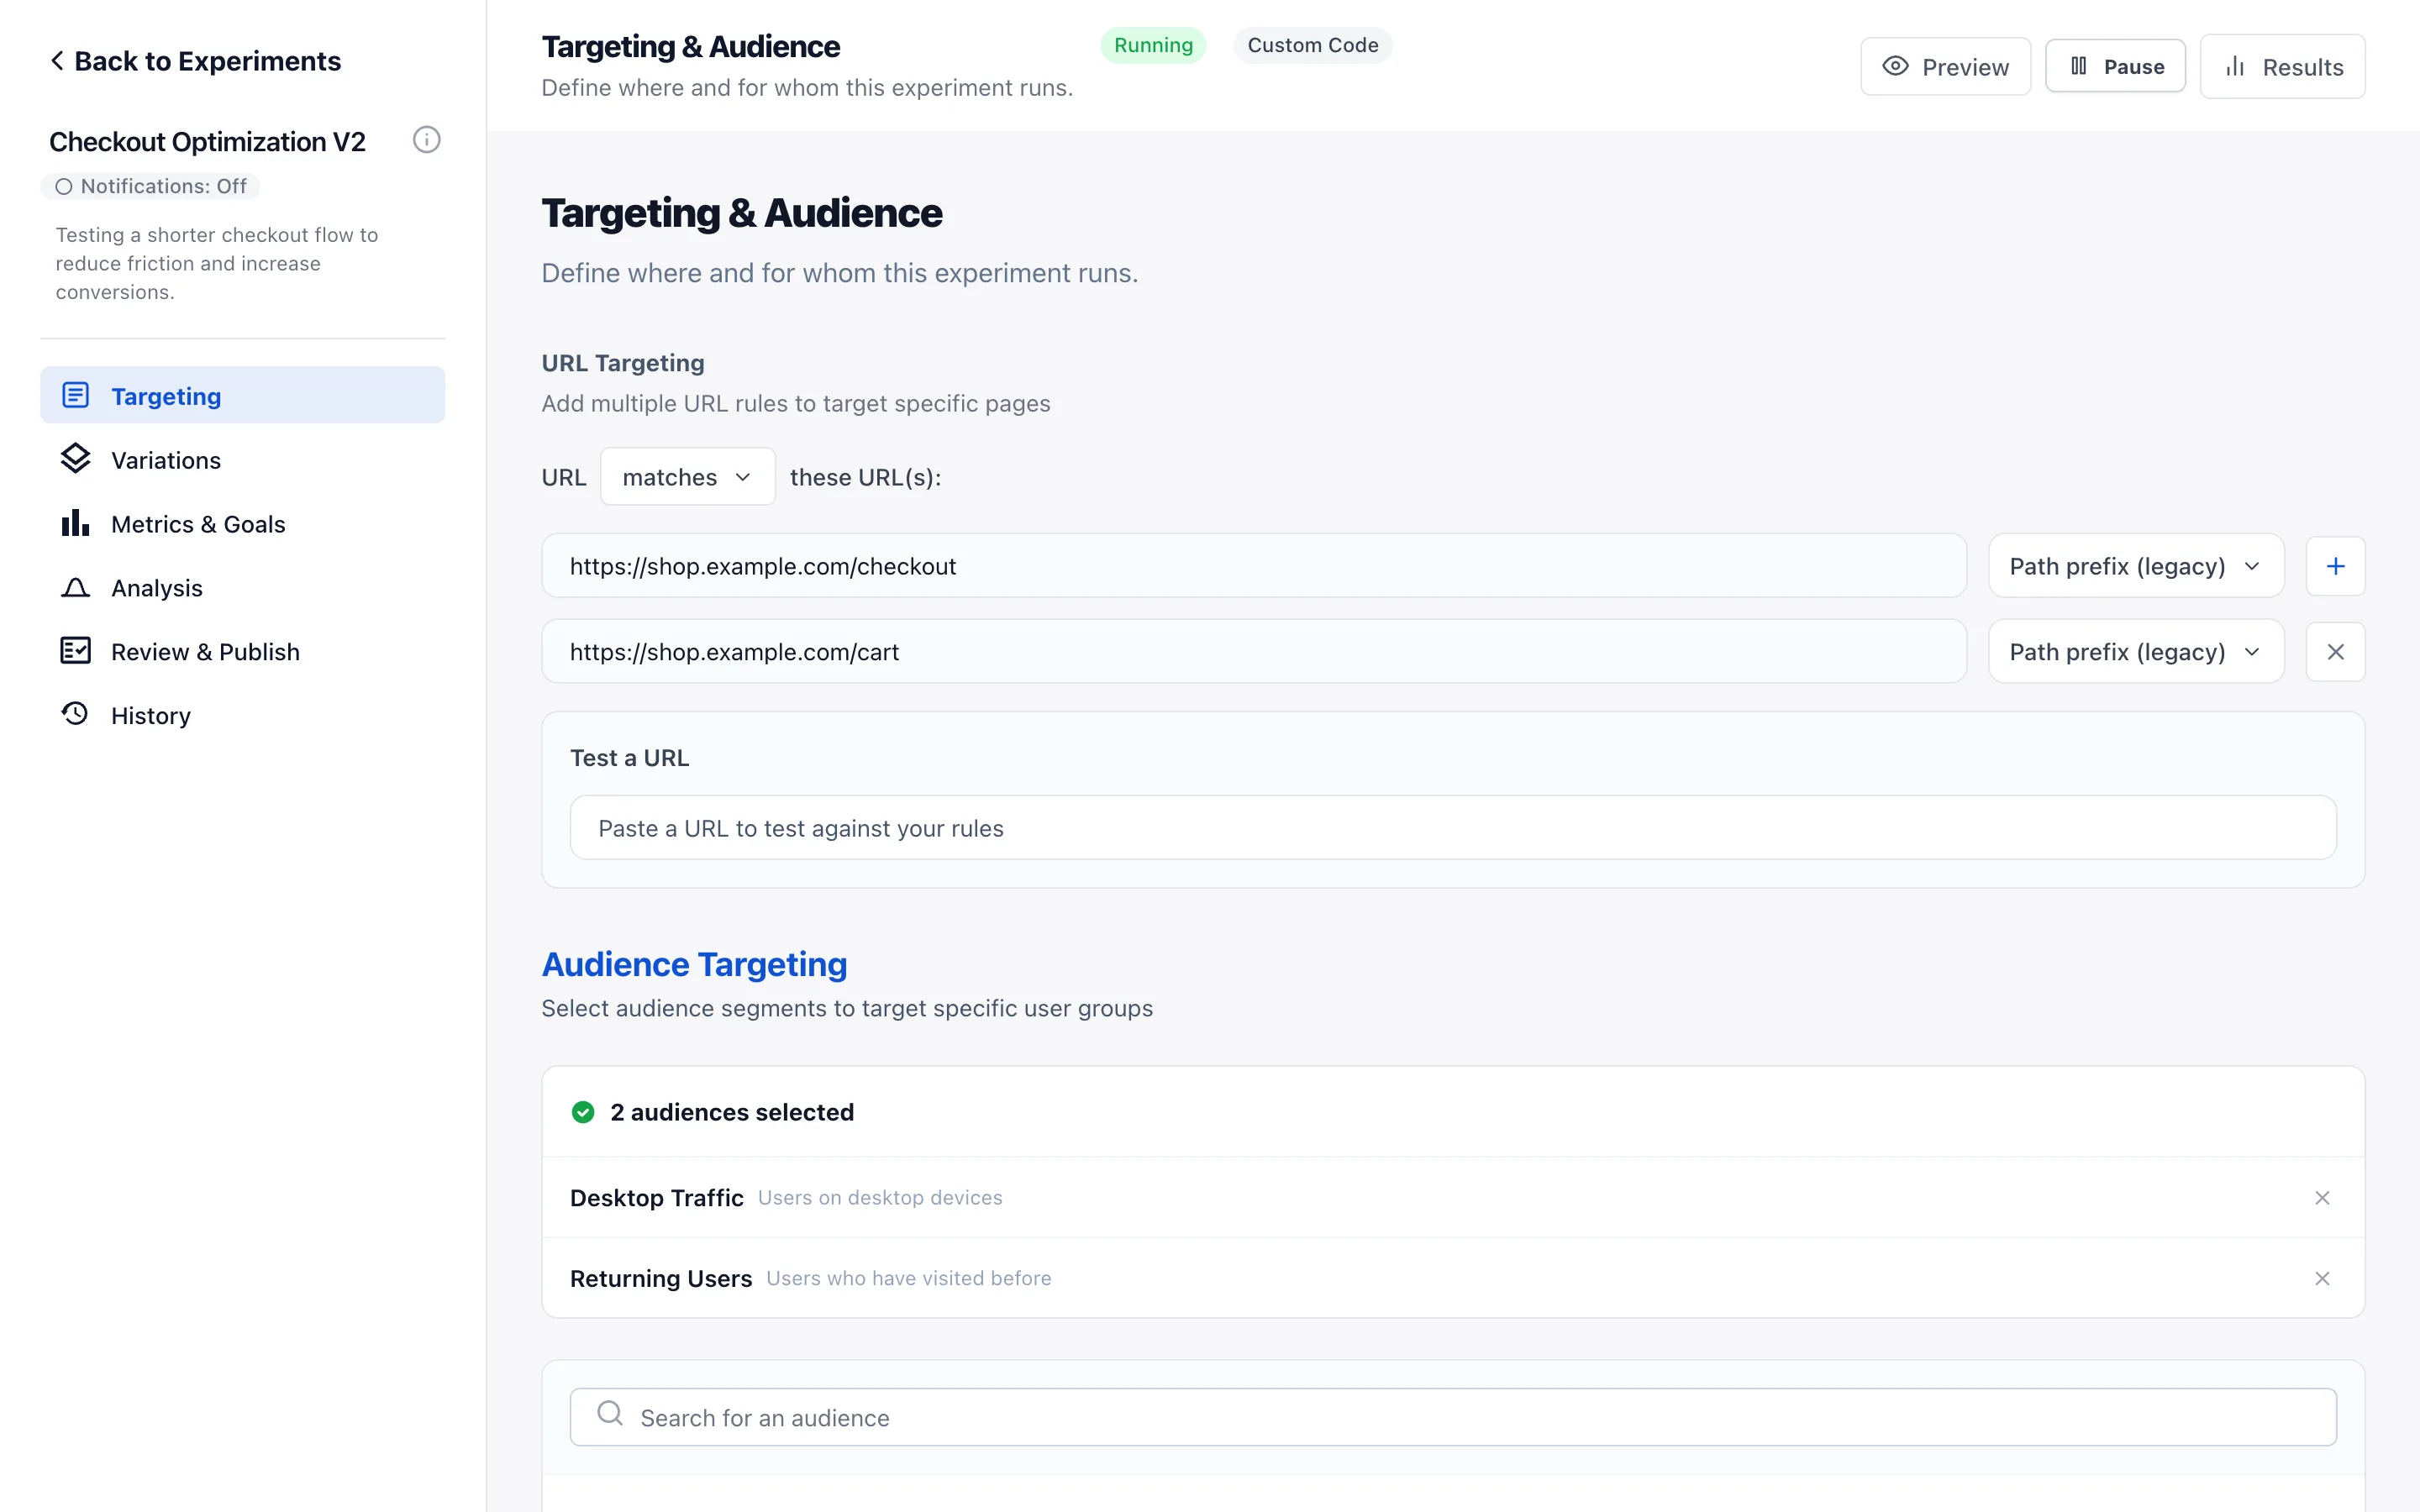
The same rules run in the visitor’s browser for site experiments, and on your own servers for server-side use. One rule set, two places. Either way, a visitor always gets the same variation they got last time, decided on the spot with no round trip to us.
Pause and new visitors stop entering the test, while anyone already in it goes back to the original page. Everything you have collected so far is kept. Scheduling handles time zones and daylight saving, so 9am Tuesday means 9am local. If something goes wrong at the moment of launch, a one-hour catch-up window still starts it. You choose how much traffic goes in, from 0 to 100 percent, and how it splits across variations.
Split traffic across experiments running at the same time, so no visitor sees two changes to the same part of the page at once. Make a group, add the experiments to it, and each visitor is placed the moment they arrive.
Illustrative. One group, three experiments, no overlap.
No flash of the original.
The page is held for up to three seconds while the variation applies, then shown all at once, so visitors never see the original flash past.
New views are handled.
When your app moves a visitor to a new view without a page load, the variation is worked out again and re-applied.
Nothing runs until you say so.
Nothing runs and nothing is tracked until your consent tool gives the go-ahead.
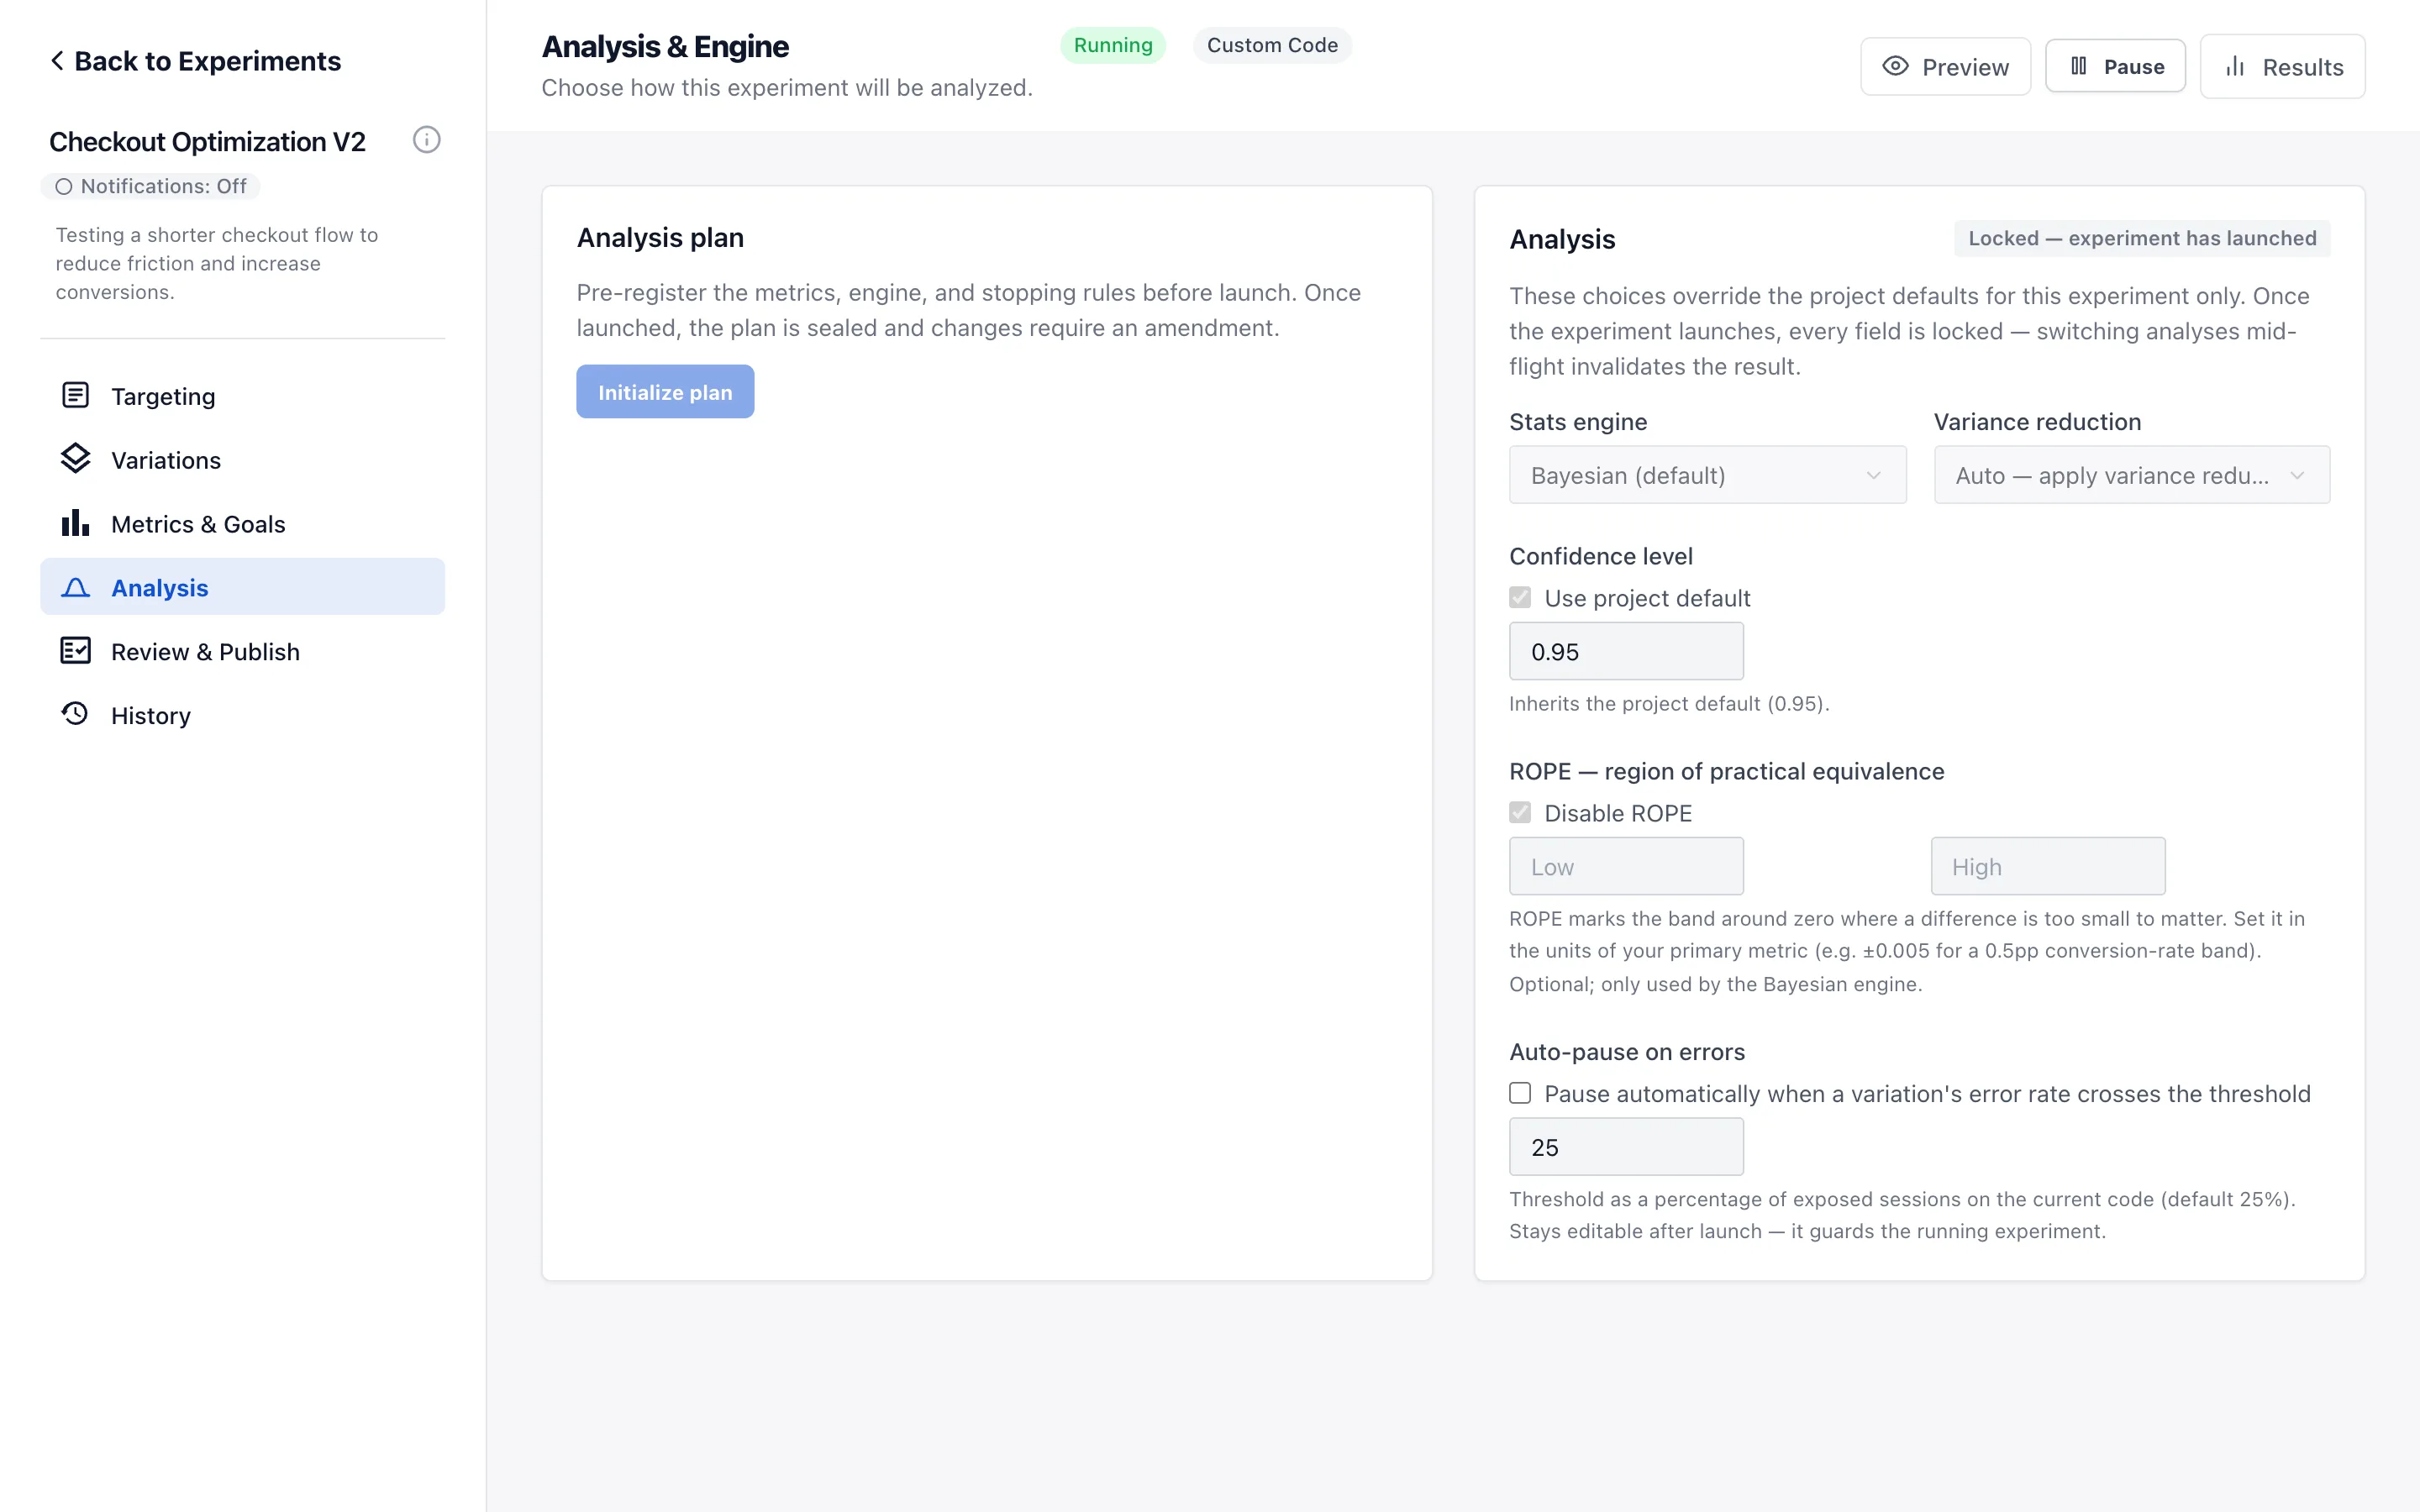
You write the analysis plan before the test starts, and it seals the moment traffic begins. After that it is read-only, so the bar you set is the bar you are judged against. If it has to change, every change is recorded field by field: what changed, from what, to what, by whom, when, and why.
A/A mode runs the control against itself. If it finds a winner, something in your setup is wrong, and you find that out before you trust a real test.
You set the confidence level, anywhere from 80 to 99 percent. It starts at 95 percent.
Set the range of results you would treat as no real difference. Rate metrics come with a suggested default. For money, counts, or percentiles, nothing is assumed until you set a number yourself.
Stopping a Frequentist test early is the easiest way to get a wrong answer, so three guards sit in the way: a banner showing how far through the planned sample you really are, a confirmation that blocks the stop rather than warning about it, and a permanent record of the override. You can always overrule all three. It is always written down.
This is one real page in both of its states, at the same width and the same scroll position. Drag the handle and the only thing that moves is the change being tested. Everything else on this page is about knowing whether that change worked.


One row per side of the split, with its own visitors, conversions and conversion rate, the lift between them, and the interval drawn around that lift. Filters, metrics, intervals, and segment breakdowns sit in one place, so you pick a date range and a segment, read the lift, and check the health signals before anyone starts drafting a recommendation.
Example figures, drawn the way the product draws them.
Different questions need different tests, the same way a doctor does not use one test for a broken bone and a fever. You get 3 genuinely different engines, not one formula with settings, and the page tells you which one produced the number you are reading.
Answers "how likely is the challenger actually better", as a plain probability, with no fixed sample size to wait for.
A direct, exact read on which variation is likely better, useful at low to mid traffic where waiting for a fixed sample size is expensive.
The textbook significance test most stats teams already trust, planned around a sample size you set in advance.
High-traffic teams who want the same framework their stats team already reports on.
Checking the result every day cannot manufacture a false winner.
Teams that check results often and want to stop the moment a real result lands, without inflating the false-alarm rate.
The always-valid engine uses a published method from the statistics literature, not an approximation of our own. The Bayesian engine is exact and deterministic: the same data always produces the same number, with no flicker between refreshes, and by default it takes no position at all before it sees your data.
Every result is graded A to F, out of 100, on how the test was run rather than on how much you wanted it to work. It is a fixed formula with no AI in it and no way to override it. A broken traffic split caps the grade at D, and a lift too large to believe caps it at B until you check your tracking.
When a result crosses the line, the lift you are looking at is biased upward, because you are looking at it precisely because it won. We show the corrected figure beside it, together with the odds that the true effect points the other way.
For money metrics, once there is enough traffic, the page puts the cost of shipping a secretly worse variation next to the upside of holding, in currency.
Guardrail metrics get a real pass or fail test with three honest outcomes: Safe, Breached, or Inconclusive. A guardrail you cannot fail is decoration.
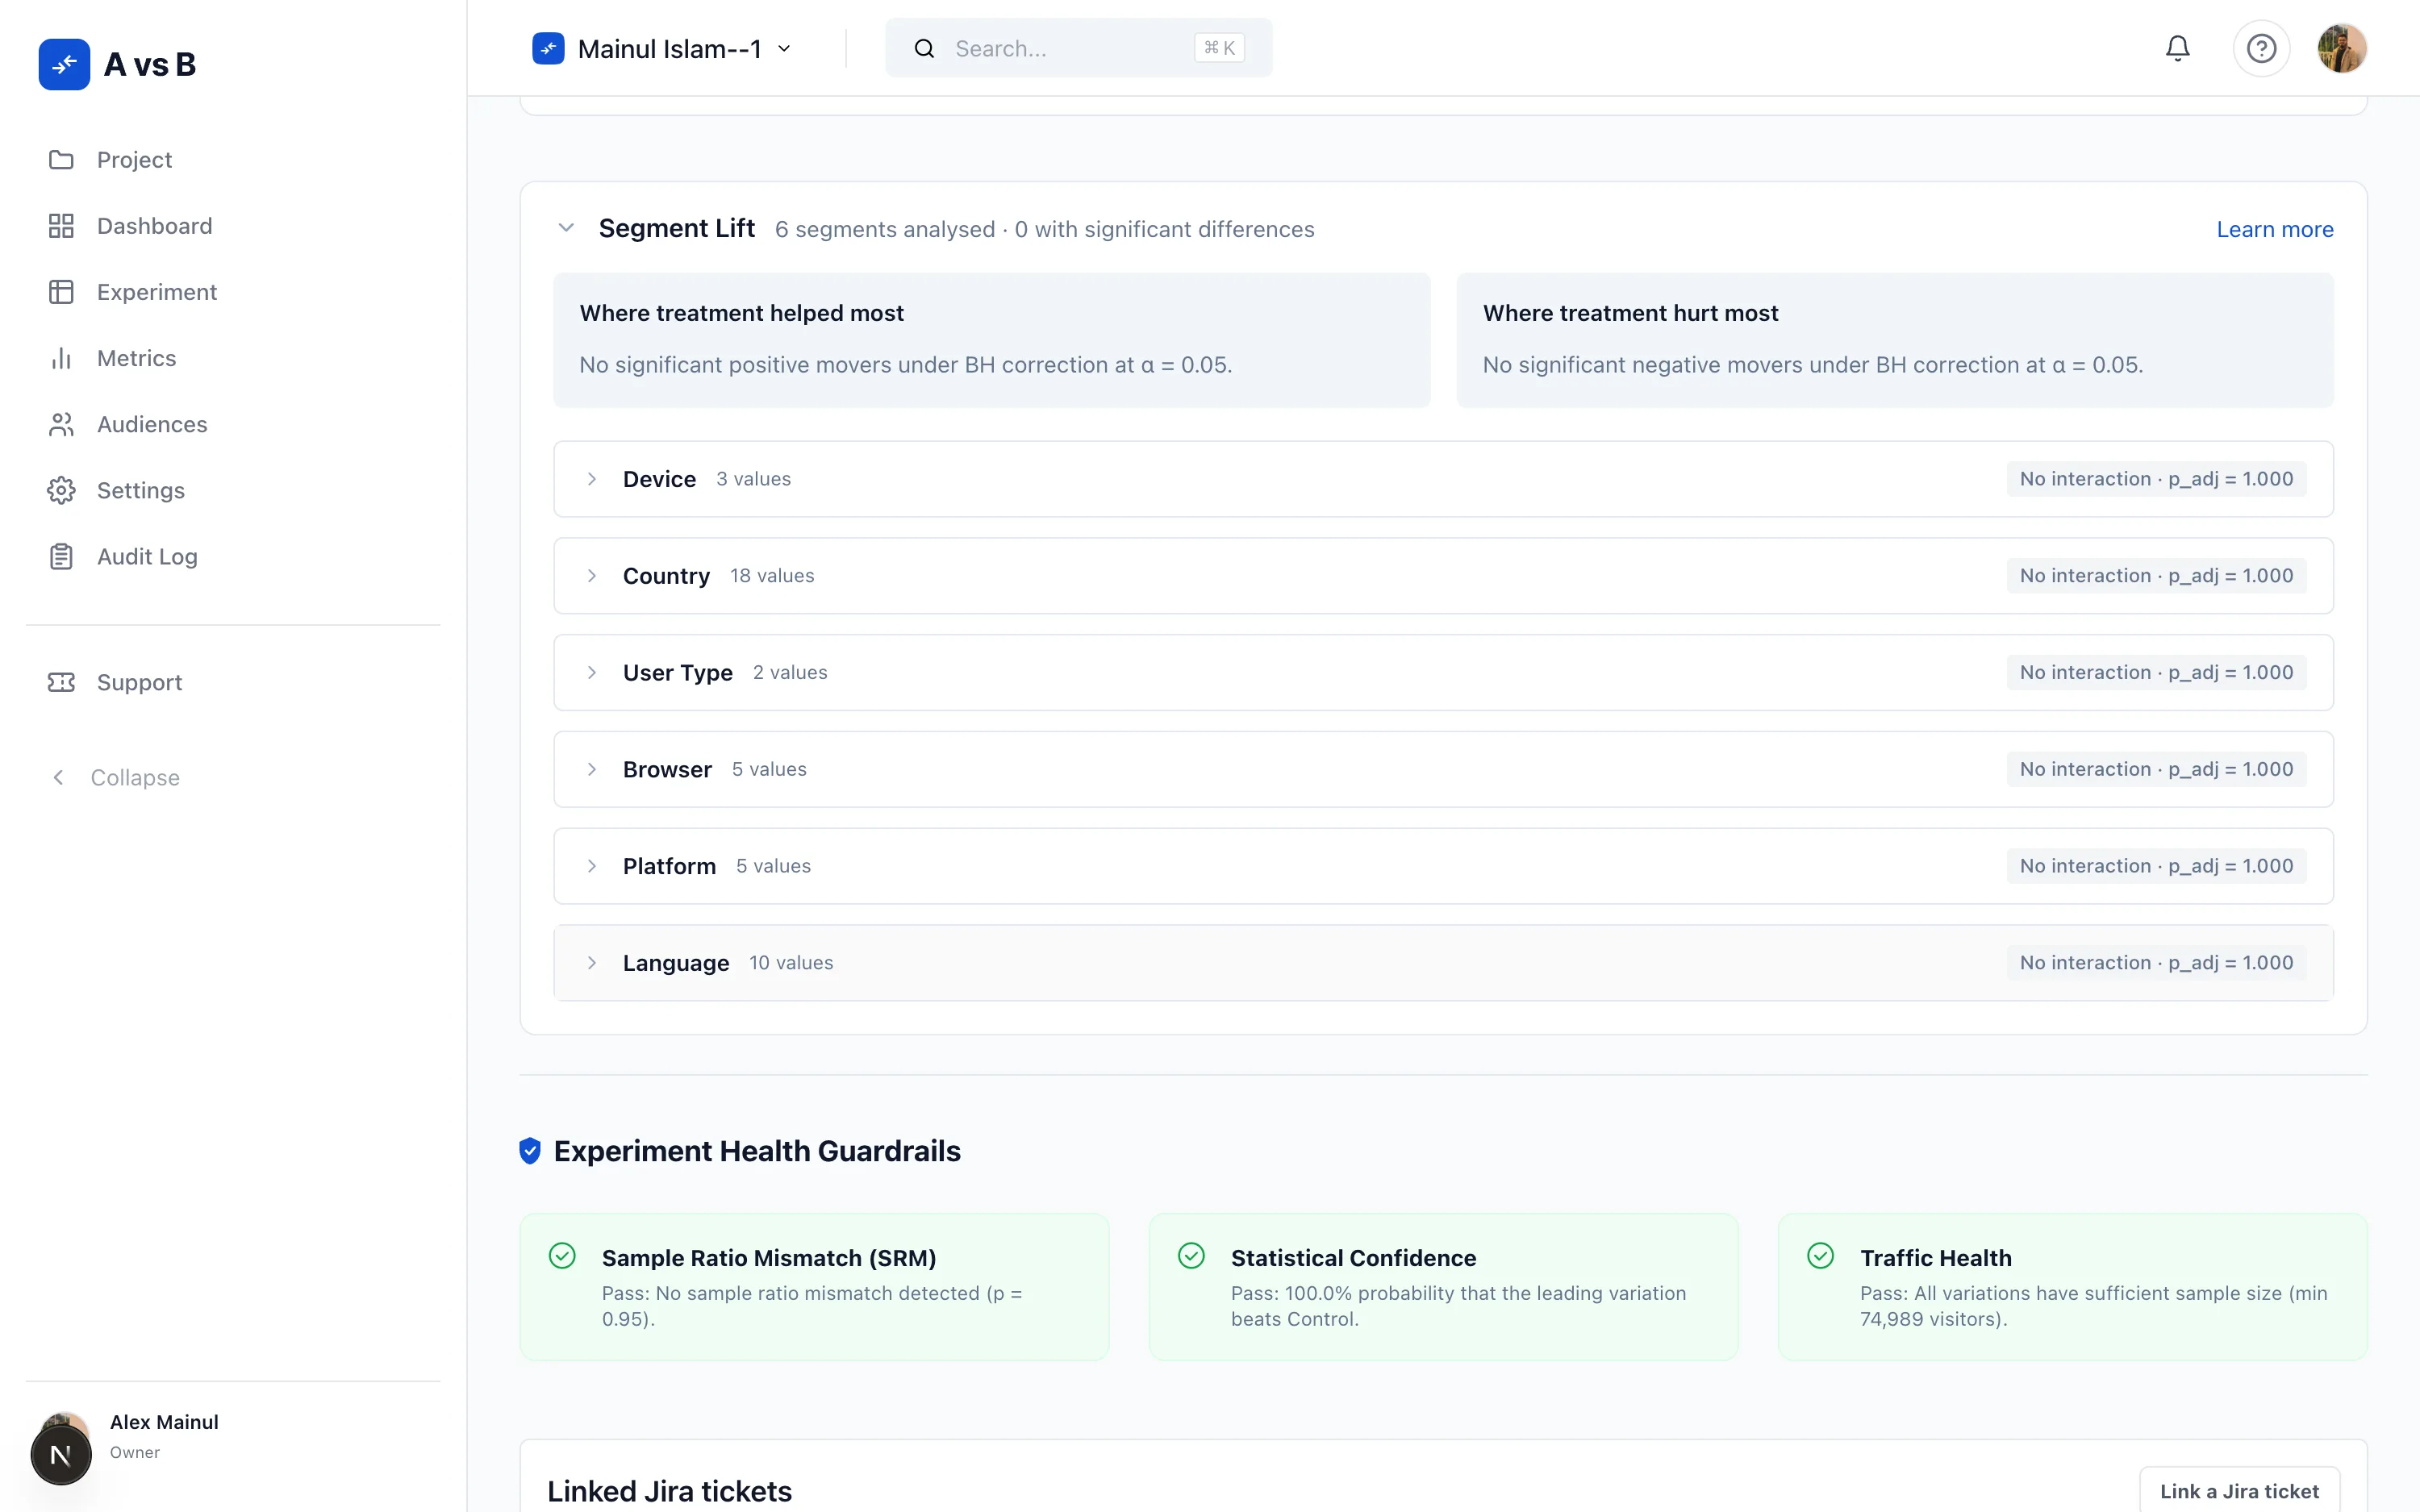
Sample ratio mismatch detection measured from the last time your split changed, not from all time, plus three plain health signals: data quality, statistical confidence, and traffic health.
Go looking for a winner once the test is over and we still show you the numbers, but we withhold the ship or stop verdict and say why: a winner found only by slicing is not one you can trust.
Six ways to correct for testing many things at once, and a default that keeps the metric you are deciding on separate from the ones you are only watching.
Under the always-valid engine, a looser correction is automatically swapped for a stricter one, because the looser one stops being valid once you check the result whenever you like. The swap is stated on screen, not made quietly.
Ratio metrics get proper variance handling, and when the baseline is only weakly known the interval switches to a more rigorous method and reports that it cannot be determined rather than printing a range that would mislead you.
If a variation starts throwing errors past a threshold you set, it pauses itself. That is on by default, at 25 percent, and you can change it. Every experiment keeps its own error log: script errors, changes that failed to apply, and elements that were not found. Rates appear once at least 50 visitors have seen the variation.
One bad variation does not cost you the experiment. Turn that variation off from the experiment dashboard and leave the rest running. Stopping, though, is permanent. The experiment moves to Completed, the variation code leaves your site straight away, and the results are kept.
Free for your first 10,000 visitors a month. No card, and not a trial.